GPCR Signaling Kinetics
Data Analysis
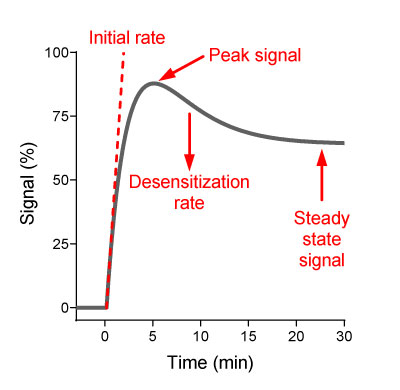
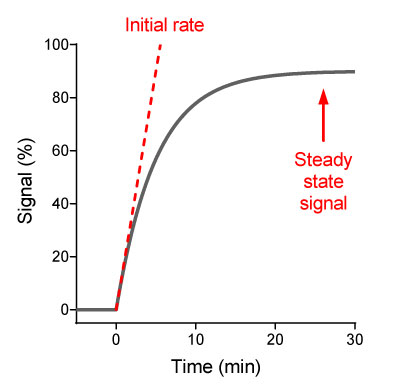
Time course equations for a variety of curve shapes entered into GraphPad Prism as a plug-in.
Parameters include:
-
- Initial rate of signal generation
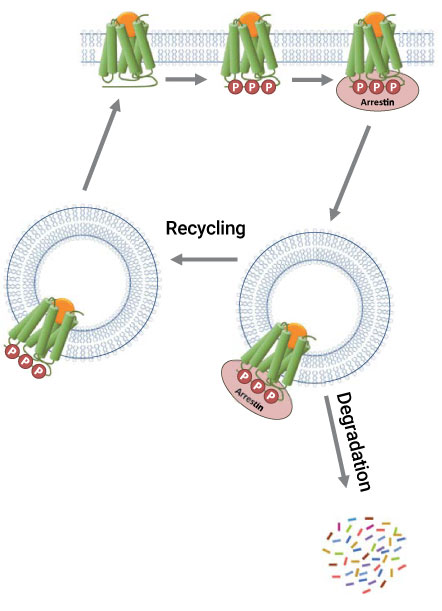
- Fade (desensitization) rate
- Steady-State signal level
- Peak level and peak time
References

Rise and fall to steady-state curve

Rise to steady-state curve
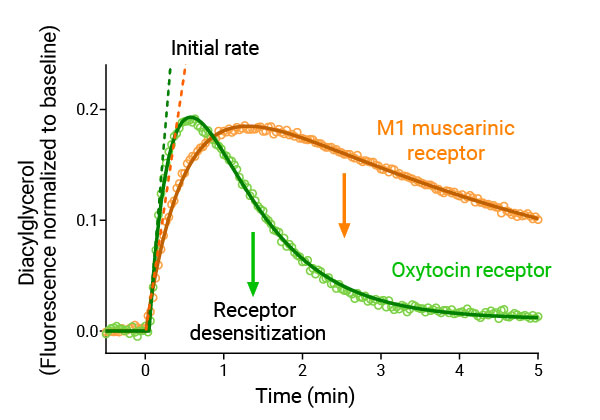
Quantifying GPCR Signaling and Desensitization Kinetics

Waveform data fitted to equations to quantify:
-
- Signal generation rate
- Desensitization rate
- Signal clearance rate
- Differences between GPCRs in signaling mechanisms and rates


