Quick-View Protocol
About these Assays #D0800G Green Down GENIe cGMP
Cyclic GMP is an important second messenger in many cellular processes, including phototransduction, smooth muscle relaxation, and synaptic plasticity. This cGMP assay is unique in that it detects cell signaling in living cells and can be targeted to specific populations of cells in mixed cultures. The assay can also be used to ascertain the specificity of PDE inhibitors. The fluorescent sensor used in the assay described here utilizes one fluorescent protein, so it can be combined with different colored sensors to measure multiple signals simultaneously.
The fluorescence of this sensor decreases in response to increasing levels of cGMP. It is bright, robust, and easy to detect on fluorescence microscopes and automated fluorescence plate readers. No need to fix or lyse your cells.
Overview
The following protocol is optimized for measuring cGMP responses in rapidly dividing, immortalized cell lines on a 96-well plate, and has been validated in live HEK 293T cells [Graham FL, 1977]. This assay is very robust and can be used for live-cell imaging or for screening on automated fluorescence plate readers. For use in iPSC-derived or adherent cells, see Suggestions for Assays in Adherent Cells section.
The BacMam vector carrying these sensors is a modified baculovirus, which can be used for delivery to, and expression in, a wide variety of mammalian cell types including primary cultures.
Materials in the Kit
Green cGMP sensor BacMam ⩰2 x10¹⁰ VG/mL in ESF 921 Insect Culture Medium (Expression Systems, product # 96-001-01).
- Green fluorescent sensor that change in fluorescence intensity in response to increases in cGMP. VG/mL is the number of viral genes per milliliter, as distinct from plaque forming units (PFU), that for baculovirus, would be measured in insect cells.
Sodium Butyrate (Sigma Aldrich product # B5887) 500 mM in H2O.
- Sodium Butyrate is added to the culture to maintain BacMam expression. Other HDAC inhibitors may work as well.
Soluble Guanylate Cyclase (sGC) BacMam in ESF 921 Insect Culture Medium (Expression Systems, product # 96-001-01)
-
To be used as a positive control for the purpose of assay optimization. Produces cGMP in response to Nitric Oxide induced activation.
Additional Materials Not Supplied
- Greiner CellCoat (#655946) is our preferred 96-well plate available from VWR.
- Dulbecco’s Phosphate Buffered Saline (DPBS) available from VWR [Dulbecco, R. and Vogt, M.1957].
- Nitric Oxide Donors
- Sodium Nitroprusside – Sigma #71778, #PHR1423
- DEA NONOate – Cayman Chemical #82100
- SNAP – Cayman Chemical # 82250
-
-
-
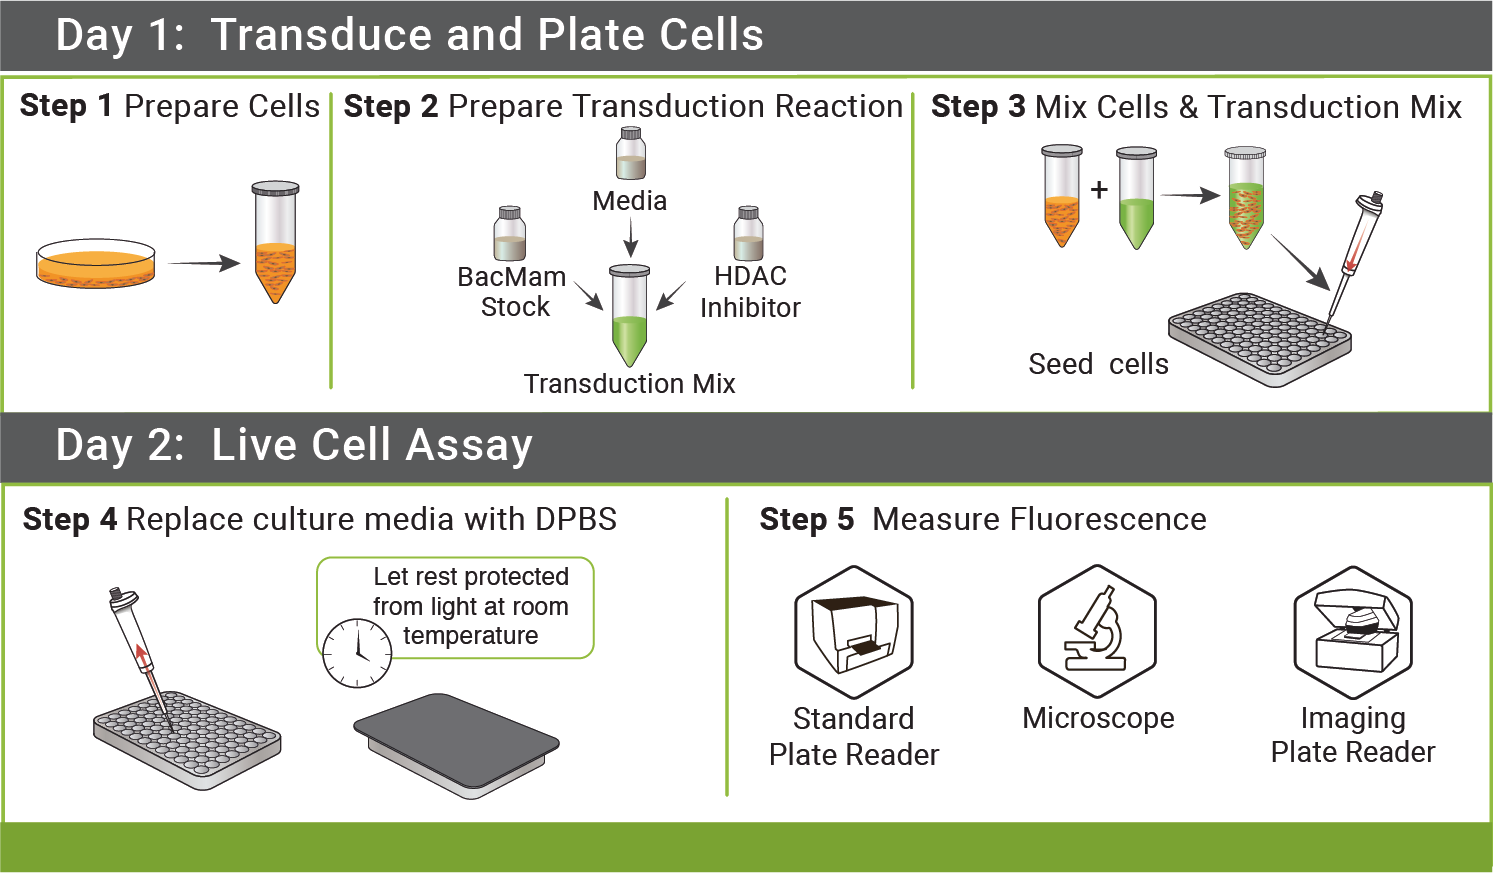
DAY 1: Transduce and Plate Cells
This protocol is optimized for rapidly dividing, immortalized cell lines in 96 well plates. However, the protocol can be adjusted for transducing non-dividing adherent cells such as neurons, islets, cardiomyocytes, and iPSC-derived lines. We recommend that you take the time to optimize the assay for your particular cell type. See our Suggestions for Other Cell Types and Plate Formats following this protocol.
Step 1: Prepare cells (Tube A)
- Detach cells from flask using standard trypsinization protocol. Re-suspend cells in complete culture media and determine cell count.
- Prepare a dilution of cells at your desired concentration* 100 μL of this cell resuspension will be required for a single well in a 96-well plate, so prepare enough of the dilution to seed the desired number of wells in the plate. Let cells sit in hood and move on to preparation of the viral transduction reaction.
* 500,000 cells/mL works well for HEK293T cells. This will result in 50,000 cells/well in a 96-well plate. Optimal cell density is cell type dependent.
Example: 96 wells needed (1 plate).
100 μL cell suspension (500,000 cells/mL) per well.
100 μL cells x 110 (96 wells + 10% scale) = 11000 μL cell suspension
*When preparing the master mix, scale up by 10-15% to avoid coming up short. To seed a 96-well plate, multiply amounts in Step 1 and Step 2 by 110-120.
Step 2: Prepare Viral Transduction Reaction (Tube B)
- Prepare a 500 mM stock solution of sodium butyrate in sterile water (in your kit).
- For each transduction reaction (i.e. one well in a 96-well plate), prepare the transduction solution by mixing 25 μL of the cGMP Sensor BacMam stock with 0.6 μL of the 500 mM stock solution of sodium butyrate*, 2 μL of the sGC control, and 22.4 μL of the complete culture media for your cells, for a total volume of 50 μL. Mix gently.
*Concentration of sodium butyrate should be 6mM in this step. Following Step 3, final concentration of sodium butyrate will be 2mM
Example: 96 wells needed (1 plate).
The number of wells desired, must correspond to the number in Step 1 above.
25 μL Sensor x 110 wells= 2750 μL
2 μL Soluble Guanylate Cyclase x 110 wells = 220 μL
0.6 μL 500 mM Sodium Butyrate x 110 wells = 66 μL
22.4μL Complete Media x 110 wells = 2464 μL
50 μL total volume per well x 110 wells = 5500 μL transduction mix (96 wells)
Step 3: Mix Cells and Transduction Mix from above.
- Mix Tube A and Tube B (100 μL tube A + 50 μL tube B). Mix gently and seed 150 μL of mix per well on the 96-well plate.
- Cover plate with aluminum foil to protect from light and incubate at room temperature for 30 minutes.
- Incubate ≈ 20-24 hrs under normal cell growth conditions, protected from light.
Example: 96 wells needed (1 plate)
100 μL cell suspension per well x 110 wells = 11000 μL master mix
50 μL transduction reaction x 110 wells = 5500 μL master mix
150 μL total volume per well x110 = 16,500 μL total reaction volume
Scaling for 384-well format
To set up the assay in 384-well plates, follow all of the protocol steps outlined above, adjusting reagent volumes as follows:
Step 1) Prepare cells (Tube A)
- 50 μL of the cell resuspension will be required for a single well in a 384-well plate. A plating density of 12,500 cells per well is a good starting point, so prepare the cell suspension at 250,000 cells/mL. Depending on the cell type and plate type, 10,000-15,000 cells per well may be optimal.
Step 2) Prepare Viral Transduction Reaction (Tube B)
- For each transduction reaction (i.e. one well in a 384-well plate), prepare the transduction solution by mixing 6 μL of the Sensor BacMam stock with 0.3 μL of the 500 mM stock solution of sodium butyrate, 0.5 μL of the Soluble Guanylate Cyclase, and 18.2 μL of the complete culture media for your cells, for a total volume of 25 μL. Mix gently
Step 3) Mix Cells and Transduction Mix from above.
- Mix Tube A and Tube B (50 μL tube A + 25 μL tube B). Mix gently and seed 75 μL of the mix per well on the 384-well plate.
* In step 1, the volume of the cell suspension per well can be reduced from 50uL to 25 uL if desired, for a final plating volume of 50uL per well after the completion of step 3. Make sure that the well is still receiving 12,500 cells.
Protocol Recommendations for CHO Cells
For the best results in CHO cells on a fluorescent plate reader, we recommend ordering our purified, high titer BacMam stock. We recommend using Valproic Acid as an HDAC inhibitor to boost expression in CHO cells at a final concentration of 5 mM.
To set up the assay in CHO cells, in 96-well format, please follow the general protocol for HEK cells in 96-well plates (above), adjusting cell densities and reagent volumes as follows:
Step 1) Prepare cells (Tube A)
- Prepare a dilution of cells at your desired concentration.* 100 μL of this cell resuspension will be required for a single well in a 96-well plate.
*210,000 cells/mL works well for CHO cells. This will result in 21,000 cells/well in a 96-well plate. Depending on the plate type being used, 20,000-22,000 cells per well may be optimal.
Step 2) Prepare Viral Transduction Reaction (Tube B)
- For each transduction reaction (i.e. one well in a 96-well plate), prepare the transduction solution by mixing *5 μL of the Purified Sensor BacMam stock with 2.5 μL of the 300 mM stock solution of Valproic Acid, 0.4 μL of the Soluble Guanylate Cyclase, and 42.5 μL of the complete culture media for your cells, for a total volume of 50 μL. Mix gently.
*5μL of Purified Sensor BacMam stock is a good starting point, but a range of 2-10 μL may need to be tested if 4μL is suboptimal.
DAY 2: Measuring Fluorescence
- Prior to measuring fluorescence, replace culture media with DPBS (containing calcium and magnesium). Wash gently so as not to dislodge cells. Cover the cells and allow them to rest at room temperature in DPBS for 25-40 minutes before measuring fluorescence so they can adjust to their new environment. Experiments are performed at 25°C using standard GFP excitation and emission wavelengths.
- Use positive controls. Add 30μM Sodium Nitroprusside (SNP, final concentration in well), or other nitric oxide donor, to activate a set of wells transduced with the Soluble Guanylate Cyclase (sGC) included in the kit. Add the NO donor in a volume of 50μL DPBS, to wells containing 100-150μL DPBS.
- When monitoring the green fluorescence emitted by the sensor, a decrease in fluorescence intensity will be observed after addition of compounds that increase levels of cGMP in the cell.
Fluorescence Detection
Our assays are compatible with automated fluorescent plate readers. Our customers have reported good results on:
- Hamamatsu FDSS
- Molecular Devices FLIPR
- Molecular Devices Flexstation
- Perkin Elmer Enspire
We have validated on:
- Biotek Synergy MX
- Biotek Cytation
- BMG CLARIOstar
- Epifluorescence microscopes
Fluorescence Properties
GENIe is constructed with the very bright, mNeon green fluorescent protein [6]. While the optimal excitation and emission wavelengths are 506 nm and 517 nm, respectively, a range of 485-505 nm for excitation and 515-535 nm for emission may be used. We recommend Chroma’s Catalog set #49003 for optimal results. Preferred excitation and emission wavelengths for mNeon Green are 488/525.
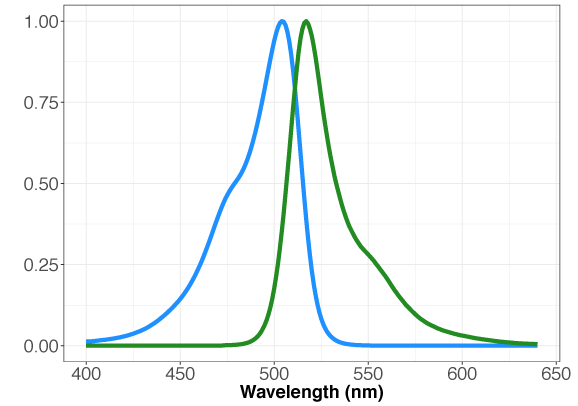
Figure 1. Absorption and emission properties of the mNeon green fluorescent protein plotted as a function of wavelength.
Timing
This cGMP assay measures cGMP in living cells, in real time. For best results, be sure to capture changes in cGMP during the peak response. In Figure 2, fluorescence was captured from cells before the addition of the drug and then sampled at regular intervals. The maximal response is reached ~ 30 minutes after the addition of the drug when using the sGC positive control.
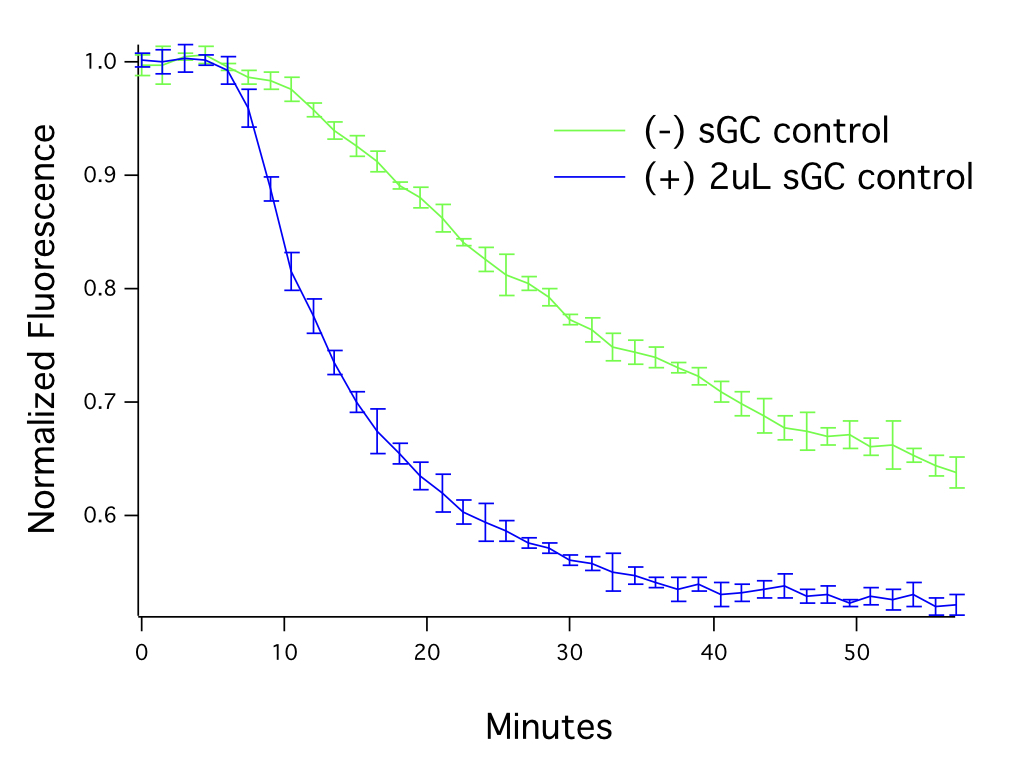
Figure 2. The level of guanylate cyclase in the cells affects assay performance. HEK293T cells transduced with 20 μL of Green Downward cGMP sensor BacMam, activated with SNP (50μM). The graph shows assay responses with and without addition of soluble guanylate cyclase (sGC).
Suggestions for Assays in Adherent Cells
The protocol above is optimized for rapidly dividing immortalized cells. However, these assays are compatible with screening primary cultures and iPSC-derived lines, where the cells are plated before transduction. Specific details of the protocol will vary by cell type, so it is important to take the time to titrate BacMam for optimal results. For expression in rare cell types, or specific cells in mixed cultures, Cre-dependent and specific promoter systems are available for many of our sensors.
- Prepare a 500 mM stock solution of sodium butyrate in sterile water (provided in your kit).
- For each transduction reaction (i.e. one well in a 96-well plate, containing 100μL culture media per well), prepare a transduction solution by mixing 20 μL of the Sensor BacMam stock with 5 μL of Receptor control, 24.4 μL of DPBS, and 0.6 μL of the 500 mM stock solution of sodium butyrate for a total volume of 50 μL. Mix the solution gently.
- Sensor expression and cell health can be controlled by titrating the virus, so it is worth taking the time to optimize the assay for your particular cell type. Cell Culture media may be used in place of DPBS in the step above. See the assay optimization section for more information.
- Add the transduction reaction directly to the plated cells (no aspiration of cell medium necessary). Gently rock the plate 4-5 times in each direction to mix throughout the well. Incubate the cells under normal growth conditions (5% CO2and 37°C), protected from light, for 20-24 hrs.
- Optional step (cell type dependent): After 4-8 hr incubation with Sensor BacMam (6 hrs is optimal), aspirate transduction solution and add 100 μL complete growth medium with sodium butyrate at a concentration of 2 mM. Return cells to normal growth conditions for approximately 16-20 hrs before measuring fluorescence as described above. If cells will not tolerate a full media exchange, partial media exchanges can be done.
Assay Optimization
Are your cells fluorescent?
Twenty four hours after transduction, you should see bright green fluorescent cells in a typical epifluorescence microscope, or the transduced wells in a 96 well plate should be significantly more fluorescent than untransduced cells in wells on the same plate.
HDAC inhibitors may be important to maintain expression of the sensors.While BacMam transduction alone will result in sensor expression, sodium butyrate or another HDAC inhibitor, such as valproic acid (VPA) or trichostatin A (TSA), will generate higher levels of expression and will maintain this level of expression [Kost, T. et. al. 2007]. If cells look unhealthy, use lower concentrations or no HDAC inhibitor.
Finally, the type of cell culture media used in your experiment can affect the transduction efficiency of BacMam. Our assays have been validated in EMEM, DMEM, and F12K culture media.
Optimizing expression of the fluorescent sensor
It is important to optimize expression for your particular cell type. Too little virus will produce variable results, particularly if the sensor expression levels are low and difficult to detect on your instrument. Baseline fluorescence goes up as you add more virus, and when a particular threshold is reached the absolute change in sensor fluorescence and the Z’ for the assay become constant. As shown below in Figure 3.
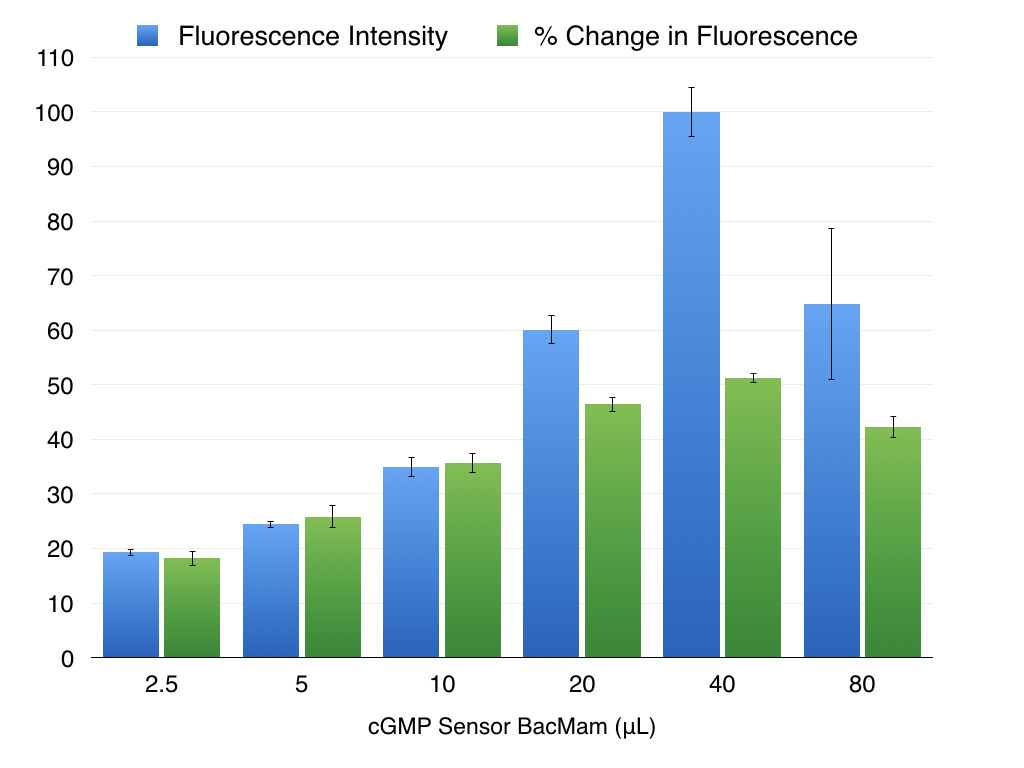
Figure 3. As the amount of cGMP Sensor BacMam added to the wells increases, so does the baseline fluorescence, plotted in blue. The change in fluorescence when cGMP changes also increases with more virus, but reaches the maximum possible change and then begins to decline as more virus is added (green bars). Expression in HEK293T cells. cGMP signal initiated with 30μM SNP.
To determine optimal conditions for your cell type, prepare a dilution series of transduction reactions by varying the amount of BacMam. For example, a range of 5 μL to 50 μL is a good starting range.
Varying the cell density, concentration of sodium butyrate, or trying a new HDAC inhibitor (VPA or TSA) may boost expression as well.
Please contact us if you would like to use the sensor under the control of a specific promoter system. Sensors under weak promoters may be limited to detection on imaging systems. To maintain strong expression in specific cell types, we recommend ordering a Cre-inducible, floxed sensor.
We also provide a more highly refined and concentrated viral preparation upon request, which can increase expression in particularly sensitive or difficult to transduce cell types.
Optimizing guanylate cyclase expression
The magnitude and kinetics of the sensor response can be affected by the level of guanylate cyclase expression in your cells (Figure 2). A soluble guanylate cyclase (sGC) BacMam has been provided in the kit, and can be activated with various nitric oxide donors, including SNP (sodium nitroprusside), DEA NONOate, and SNAP. Adding too much of the sGC positive control can lead to cytotoxic effects, so it is important to perform a titration to determine the optimal amount of sGC for the assay in your particular cell type. The reaction setup provided on page 5 of this protocol provides a good starting point.
Addition of an NO donor will cause a change in fluorescence, as shown in Figure 2. If it does not, then it is important to use this positive control to optimize three aspects of your assay. First, a serial dilution series of the sensor with a constant amount of receptor virus can be used to find the optimal sensor expression for your instrument and cell line. Second, it is important that you find the amount of virus sufficient to transduce all of the cells in the well. Third, it is important to determine what the kinetics of the response is and whether your instrument can measure in the appropriate time frame.
cGMP signals produced via endogenous guanylate cyclase activation can be enhanced by activating the gaunylate cyclase in the presence of PDE inhibitors (e.g. Sildenafil), as can be seen in Figure 4. This approach, especially when combined with our cADDis cAMP sensors, can also be used to investigate the specificity of PDE inhibitors.
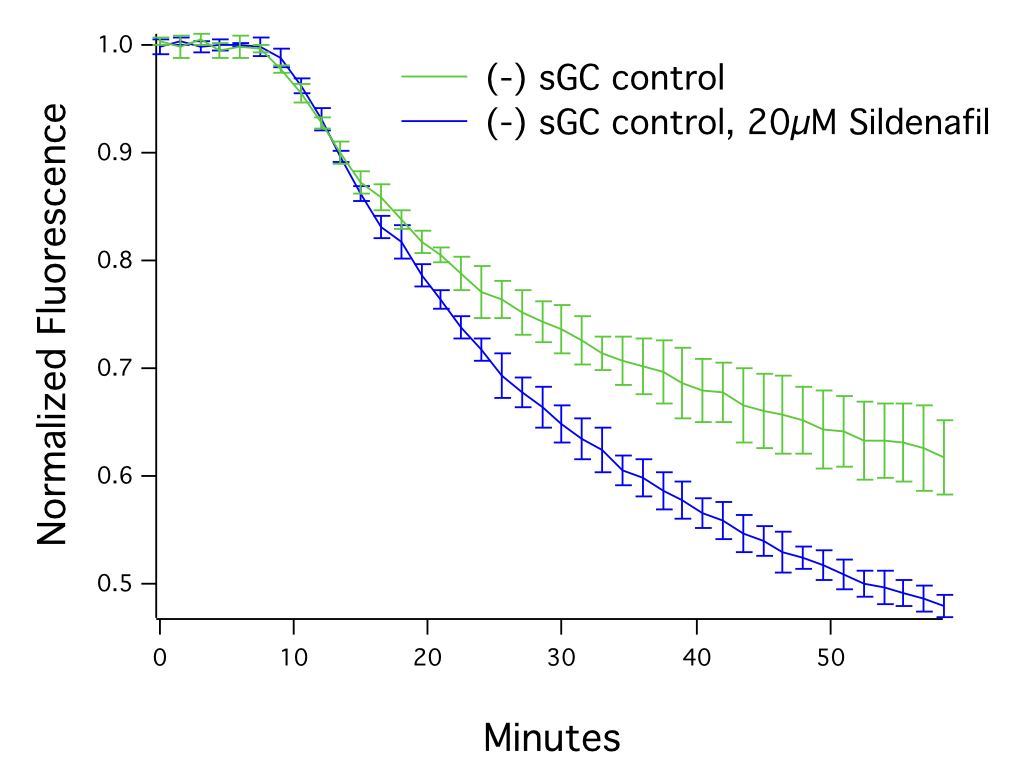
Figure 4. HEK293T cells transduced with 25 μL of Green Downward cGMP Sensor BacMam, activated with SNP (30μM) after 7.5 minutes, in the presence or absence of 20μM Sildenafil. N = 5 per condition, mean ± stdev.
Storage/Biosafety/Warranty
Storage
BacMam stocks should be stored at 4°C and protected from light. Avoid repeated freeze/thaw cycles.
BioSafety Considerations
The BacMam vector carrying the fluorescent biosensors used in these assays is a modified baculovirus, which can be used for delivery to, and expression in, a wide variety of mammalian cell types including primary cultures.
BacMam is a modified baculovirus, Autographa californica, AcMNPV. The natural host of baculovirus is larvae of the order Lepidoptera.The BacMam vector in the kit is produced in the lab using Sf9 insect cells and is pseudotyped to infect mammalian cells. In mammalian cells, the baculovirus genome is silent, and it cannot replicate to produce new virus in mammalian cells. While it should be handled carefully, in a sterile environment, it is classified as a Biosafety Level 1 (BSL-1) reagent.
Other types of viruses are quantified in terms of plaque forming units (PFU) in cells from the natural host. Since BacMam is modified to produce expression in mammalian cells, we quantify the virus by measuring viral genes (VG) per milliliter (mL). Viral samples are prepared to release viral genomic DNA, then multiple dilutions of the preparation are run in qPCR using primers that are specific to the VSVG gene in the BacMam genome. Results are compared against a standard curve to generate an average titer for each viral stock. Check the label on the tube to find VG/mL for your stock.
This product is for research use only and is not recommended for use or sale in human or animal diagnostic or therapeutic products.
Warranty Materials are provided without warranty, express or implied. End user is responsible for making sure product use complies with applicable regulations. No right to resell products or any components of these products is conveyed.
Trouble Shooting
Problem 1: Low sensor expression and/or poor transduction efficiency
Problem 2: Low fluorescence signal on microscope/plate reader
Problem 3: Signal-to-background is low (i.e. cells/wells with sensor are not much brighter than control cells/wells without sensor)
Problem 4: Signal is noisy
Problem 5: Good fluorescence signal, but sensor is not responding to drug as expected. No change in fluorescence observed, or signal is in the wrong direction.
Problem 6: Poor cell health, cells detaching from plate.
Problem 1: Low sensor expression and/or poor transduction efficiency
- Possible Cause—Suboptimal sensor BacMam volume is being used
Solution→ Perform titration of the sensor BacMam stock, testing a large range (i.e. 5-50μL in 96-well plate format) to identify optimal volume. Too little can result in low expression, too much can cause cells to become sick.
- Possible Cause—Transducing adherent cells
Solution→ Transduce cells while in suspension. If this isn’t possible, try doing a media exchange on adherent cells after 4-6hrs, in addition to leaving the virus on overnight.
- Possible Cause—Sub-optimal cell density; too few or too many cells added
Solution→ Transduce cells so that the cells will be around 75-80% confluent at the time of transduction. Also, when transducing cells in suspension, make sure that cells in the source flask are < 100% confluent (approximately 80% confluent is ideal).
- Possible Cause—HDAC inhibitor was not added to the transduction mix, or the concentration was wrong
Solution→ Add HDAC inhibitor at the proper concentration:
a) Sodium Butyrate – 2mM
b) Valproic Acid – 5mM
c) Trichostatin A – 0.25μM
*A titration can be performed to determine optimal concentration for the cell type being used.
- Possible Cause—HDAC inhibitor being used is not optimal for cell type
Solution→ Test other HDAC inhibitors (e.g. Sodium Butyrate, Valproic Acid, Trichostatin A.)
- Possible Cause—Cell type being used transduces poorly
Solution→
a) After adding transduction mix to cells, let cells sit at room temperature for 30-40 min before placing back in incubator (longer incubation times at RT may further improve transduction).
b) Perform media exchange after various incubation times with the transduction mix, in addition to leaving the virus on overnight.
c) Try high titer, purified BacMam stock.
d) Validate assay in a different cell type (e.g. HEK293 cells)
e) Transduce cells multiple times (e.g. on Day 1, and again on Day 2).
f) Incubate cells for 48 hrs post transduction, before performing assay.
g) Consider using a different viral vector, such as lentivirus or AAV.
- Possible Cause—Cell culture media is inhibiting transduction
Solution→ Remove media during transduction, preparing the transduction mix in DPBS and adding to cells. Replace transduction mix with media after 2-4 hours.
- Possible Cause—BacMam stock was not stored properly (i.e. not stored at 4℃, exposed to light for long periods, or subjected to multiple freeze-thaw cycles), or the shelf life has been exceeded.
Solution→ Follow guidelines for product storage. BacMam stocks are stable for at least 12 months when stored properly. After this time period, the stock should be reevaluated and compared to previous experiments. Purified BacMam stocks have a shelf life of 3 months.
- Possible Cause—BacMam stock was not mixed adequately before transducing cells.
Solution→ Mix BacMam stock thoroughly before transduction, especially after being stored for long periods.
- Possible Cause—Promoter is not optimal for cell type being used.
Solution→ Identify promoters that work best in the cell type being used. If promoter is not on product list, consult Montana Molecular for custom production services.
- Possible Cause—Cells are contaminated
Solution→ Monitor cells for bacteria, fungi, etc.
Problem 2: Low Fluorescence Signal on Microscope/Plate Reader
- Possible Cause—Low sensor expression, low transduction efficiency
Solution→ See solutions for Problem 1 above.
- Possible Cause—Excitation/emission settings are not optimal for the sensor being used.
Solution→ Refer to protocol for the fluorescence spectra of the sensor. Make sure that filter sets or monochromotors are aligned with the peak excitation and emission wavelengths of the sensor.
- Possible Cause—Cells are in cell culture media, and the media is producing a large fluorescent signal (autofluorescence).
Solution→ Exchange media so that cells are in DPBS at the time of experiment. If cell culture media must be used, try using FluoroBrite media.
- Possible Cause—Wrong microplate type is being used.
Solution→ Use black, clear-bottom microplates with low autofluorescence.
- Possible Cause—Exposure time or gain setting on instrument is sub-optimal.
Solution→ Test different exposure and gain settings, monitoring how the signal-to-background, and noise in the measurement, changes. Too high can result in saturation and/or photobleaching; too low can result in noisy data.
- Possible Cause—Cells were dislodged during media exchange/plate washing.
Solution→ Make sure that media exchange or plate washing is done gently and does not dislodge cells. Confirm with visual inspection on a microscope.
Problem 3: Signal-to-background is low (i.e. cells/wells with sensor are not much brighter than control cells/wells without sensor)
- Possible Cause—Low sensor expression, low transduction efficiency.
Solution→ See solutions for Problem 1 above.
- Possible Cause—Excitation/emission settings are not optimal for the sensor being used.
Solution→ Refer to protocol for the fluorescence spectra of the sensor. Make sure that filter sets or monochromators are aligned with the peak excitation and emission wavelengths of the sensor.
- Possible Cause—Exposure time or gain setting on instrument is sub-optimal.
Solution→ Test different exposure and gain settings, monitoring how the signal-to-background, and noise in the measurement, changes. Too high can result in saturation and/or photobleaching; too low can result in noisy data.
- Possible Cause—Media exchange was not performed before running the assay; cells are in media rather than DPBS. Cell culture media being used has high autofluorescence.
Solution→ Perform media exchange so that cells are in DPBS at the time of experiment. If cell culture media must be used, try using FluoroBrite media.
- Possible Cause—Cells were dislodged during media exchange/plate washing.
Solution→ Make sure that media exchange or plate washing is done gently and does not dislodge cells. Confirm with visual inspection on a microscope.
Problem 4: Signal is Noisy
- Possible Cause—Low sensor expression, low transduction efficiency.
Solution→ See solutions for Problem 1 above.
- Possible Cause—Gain setting or exposure time on instrument is too low.
Solution→ Increase gain setting or exposure time.
- Possible Cause—Media exchange was not performed, or plate washing was inadequate, causing high well-to-well variability. Cells are not in DPBS at the time of experiment.
Solution→ Exchange media so that cells are in DPBS at the time of experiment. If cell culture media must be used, try using FluoroBrite media. Make sure that plate washing is highly consistent from well to well.
- Possible Cause—Cells were dislodged during media exchange/plate washing.
Solution→ Make sure that media exchange or plate washing is done gently and does not dislodge cells. Confirm with visual inspection on a microscope.
Problem 5: Good fluorescence signal, but sensor is not responding to drug as expected. No change in fluorescence observed, or signal is in the wrong direction.
- Possible Cause—Photobleaching
Solution→ Reduce exposure time, sampling rate, and/or light intensity.
- Possible Cause—Drug is at the wrong concentration.
Solution→ Confirm drug concentration and solubility.
- Possible Cause—Drug was not stored properly.
Solution→ Confirm drug storage conditions.
- Possible Cause—Drug was added to the cells in a volume that was too low relative to the volume of DPBS/Media in the well, resulting in improper mixing.
Solution→ Add drug in a volume that will allow for sufficient diffusion (i.e. 1:3 or 1:4 drug to total volume)
- Possible Cause—Drug was not added in the same solution as the solution in the well/culture dish.
Solution→ Make sure that the drug preparation and cells are in the same solution.
- Possible Cause—Drug addition is producing an artifact.
Solution→ Make sure to add a vehicle-only control. Make sure drug is added in a solution that is the same as the solution in the well. Do not exceed 1% DMSO final in the well (0.5% or less is ideal).
- Possible Cause—Compounds being tested are fluorescent.
Solution→ Scan compounds for fluorescence to confirm. If possible, dilute compounds in order to reduce the fluorescence artifact of the compound.
- Possible Cause—Drug addition was too forceful and dislodged cells.
Solution→ Add drugs manually or with an on-board dispense function, but do so gently, so as not to dislodge cells.
- Possible Cause—Gain setting on instrument is too high, and signal is saturating. Gain setting is too low, and signal cannot be detected.
Solution→ Adjust gain setting.
- Possible Cause—Too much sensor has been added to cells and the signal is saturated (i.e. not enough analyte for the amount of sensor in the cell).
Solution→ Titrate the amount of sensor to determine maximum signal for your cell type. See protocol for recommendations for HEK293 and CHO cells.
- Possible Cause—Target receptor was not added, or expression levels are suboptimal (too little or too much, or receptor has high level of constitutive activity).
Solution→ Titrate the amount of receptor to optimize the signal for your cell type and receptor.
- Possible Cause—Sampling rate is not consistent with sensor kinetics.
Solution→ Acquire 5-10 baseline measurements before adding drug. Resume measurement quickly after adding drug (within 5-10 seconds for DAG/PIP2, 60 seconds for cADDis and cGMP, and 1-2 seconds for GECO). Measure long enough to capture max response of sensor.
- Possible Cause—Baseline reads were not acquired before adding drug.
Solution→ Acquire 5-10 baseline fluorescence reads before adding drug. Monitor for a change in fluorescence intensity upon addition of drug.
Problem 6: Poor cell health, cells detaching from plate.
- Possible Cause—Too much BacMam stock was added to cells (e.g. sensor, receptor, Gs mutant).
Solution→ Titrate lower amounts of BacMam stock to identify the optimal volume for your cells.
- Possible Cause—Concentration of HDAC inhibitor is too high, or cells are sensitive to the HDAC inhibitor being used.
Solution→ Confirm concentration of HDAC inhibitor being used. Make new stock solution. Try a different HDAC inhibitor. Confirm that they are being used at the proper concentration:
a) Sodium Butyrate – 2mM
b) Valproic Acid – 5mM
c) Trichostatin A – 0.25μM
*A titration can be performed to determine optimal concentration for the cell type being used.
- Possible Cause—Plate surface is not coated with a cell attachment factor.
Solution→ Coat plates with a cell attachment factor (e.g. PDL, laminin, collagen, fibronectin etc.) to enhance attachment
.
- Possible Cause—Edge wells are being used, and cells in the edge wells may be subject to conditions that are not conducive to growth.
Solution→ Do not use edge wells.
- Possible Cause—Cells were harmed or dislodged during media exchange/plate washing.
Solution→ Make sure that media exchange or plate washing is done gently and does not dislodge cells. Confirm with visual inspection on a microscope.
- Possible Cause—DPBS being used does not contain calcium and magnesium.
Solution→ Use DPBS containing calcium and magnesium.
- Possible Cause—Cells are contaminated.
Solution→ Monitor cells for bacteria, fungi, mycoplasma.
- Possible Cause—Cells were not grown under proper growth conditions (i.e. 5% CO2, 37°C).
Solution→ Incubate transduced cells at 37°C, in 5% CO2.
Contact Us
If you have any questions about the protocols described here, or if you have ideas about how we can improve these tools, then we want to hear from you. Your feedback is extremely valuable. Please send an email to info@montanamolecular.com, and we’ll respond as quickly as we can.
References
- Graham FL, Smiley J, Russell WC, Nairn R: Characteristics of a human cell line transformed by DNA from human adenovirus type 5. J Gen Virol 1977, 36(1):59-74.
- Dulbecco R and Vogt M: Plaque formation and isolation of pure lines with poliomyelitis viruses. The Journal of experimental medicine 1954.
- Chalfie M, Tu Y, Euskirchen G, Ward WW, Prasher DC: Green fluorescent protein as a marker for gene expression. Science 1994.
- Kost T, Condreay J, Ames R, Rees S, Romanos M: Implementation of BacMam virus gene delivery technology in a drug discovery setting. Drug Discovery Today 2007, 12(9-10):396-403.
- Tewson PH, Martinka S, Shaner N, Hughes TE, Quinn AM: New DAG and cAMP sensors optimized for live cell assays in automated laboratories. Journal of Biomolecular Screening 2015.
- Shaner, N.C., Lambert, G.G., Chammas, A., Ni, Y., Cranfill, P.J., Baird, M.A., Sell, B.R., Allen, J.R., Day, R.N., Israelsson, M., Davidson, M.W., & Wang, J. (2013) “A bright monomeric green fluorescent protein derived from Branchiostoma lanceolatum.” Nature Methods, May;10(5):407-9. doi: 10.1038/nmeth.2413.
PCT/US2014/063916 Patent Pending