GPCR Assay Services
Compound Profiling
- Measure Gs, Gi, Gq, and β-arrestin activity in real time.
- Profile multiple species, subtypes, or mutant variants of a GPCR
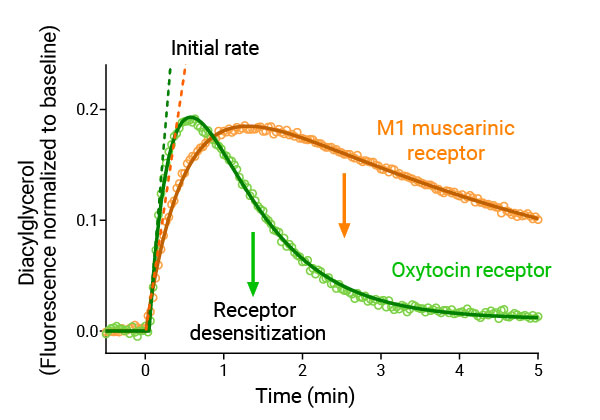
- Quantify the dynamics of signaling, including signaling duration, initial rate, and desensitization kinetics.
- Dose-response curves from initial rate, peak activation, and signal plateau.
- Quantify partial or biased agonism.
- Estimate efficacy, potency and desensitization rate.
Case study: Profiling µ-opioid receptor agonists in living cells
with biosensors for cAMP and β-arrestin.
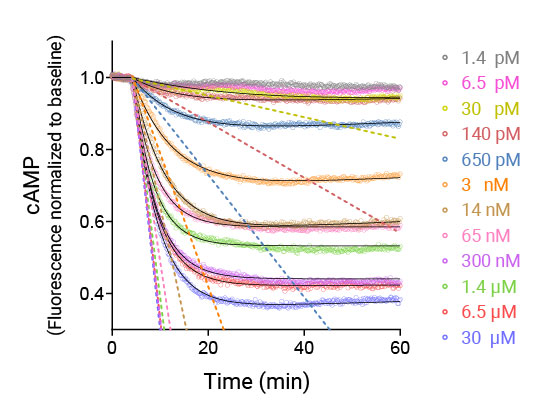
Time course data from cAMP cADDis assay fit to kinetic equations. Analysis estimates initial rate of signaling (dashed line) at each dose of morphine at the µ-opioid receptor.
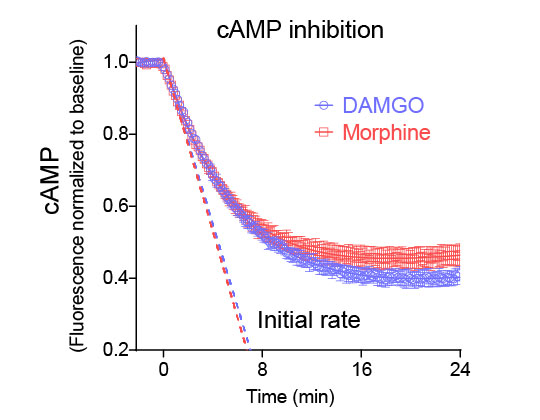
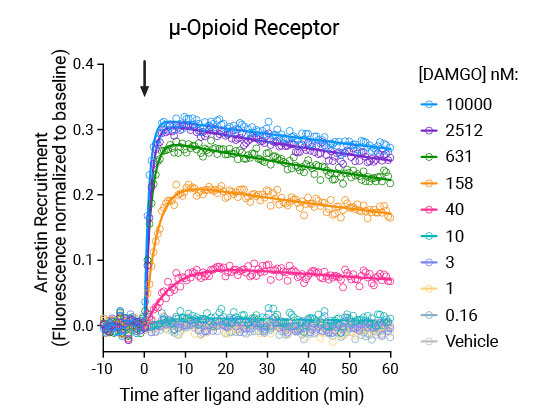
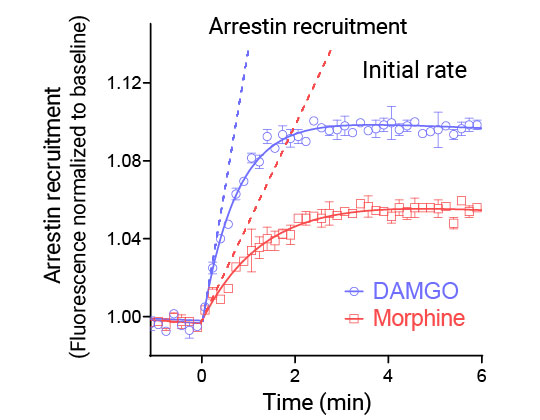
cADDis and Borealis biosensors reveal distinct temporal profiles of cAMP and arrestin signaling.
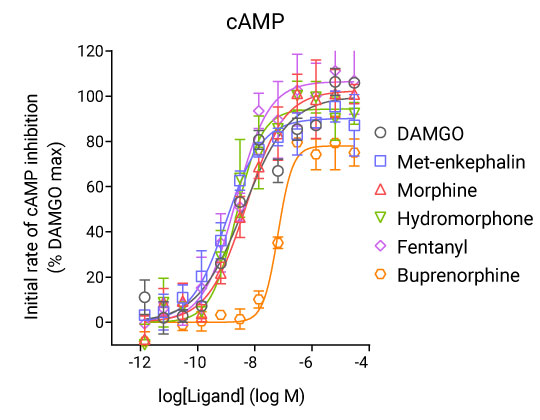
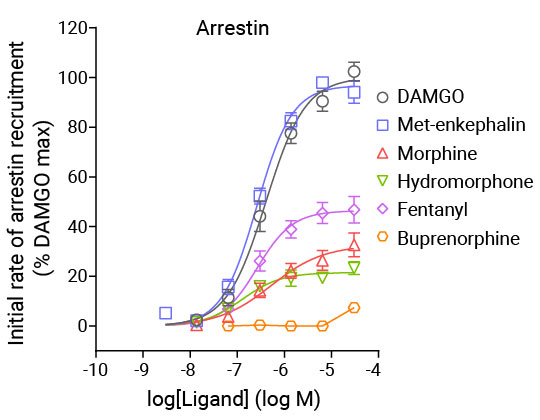
CRCs for 5 µ-opioid receptor agonists using the initial rate of activation.
Summary of results at the µ-opioid receptor
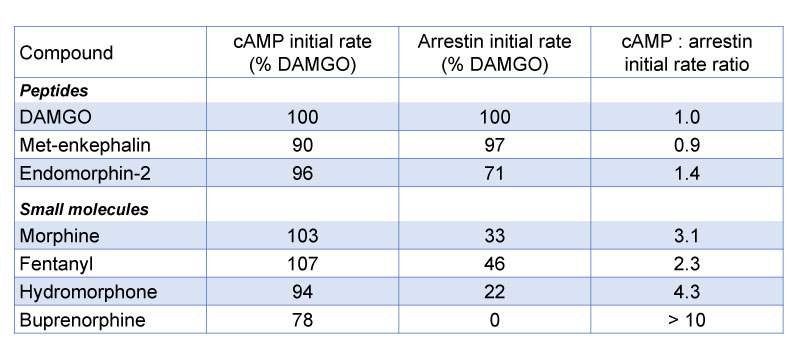
- All compounds generate cAMP at a similar rate, except buprenorphine (a partial agonist).
- Small molecules recruit arrestin more slowly than peptides.
- The ratio of initial rates can be used to quantify bias for cAMP over arrestin – small molecules are biased for cAMP.
Video: Description of our Assay Services
Data Analysis
Time course equations for a variety of curve shapes entered into GraphPad Prism as a plug-in.
Parameters include:
-
- Initial rate of signal generation
- Fade (desensitization) rate
- Steady-State signal level
- Peak level and peak time
References
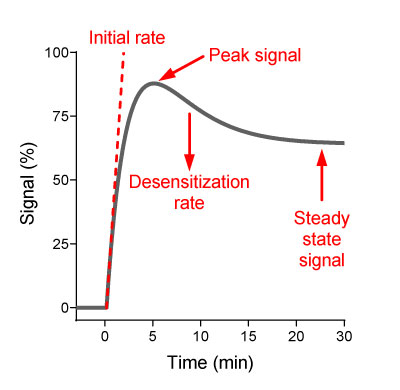
Rise and fall to steady-state curve
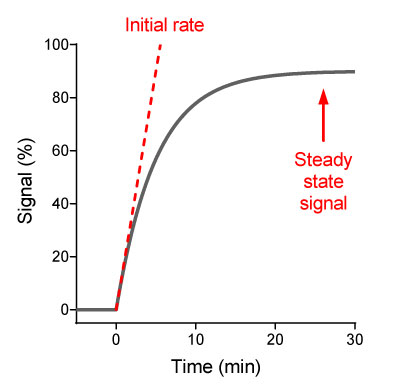
Rise to steady-state curve
Quantifying GPCR Signaling and Desensitization Kinetics
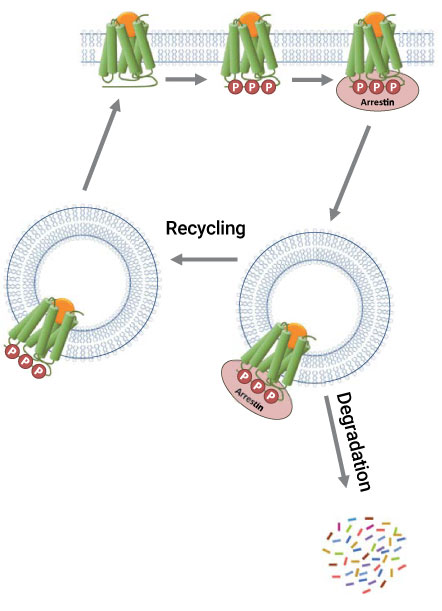
Waveform data fitted to equations to quantify:
-
- Signal generation rate
- Desensitization rate
- Signal clearance rate
- Differences between GPCRs in signaling mechanisms and rates
Video: Multi Receptor Profiling
Assay Optimization Services
Our GPCR Discovery Team can kick start your in-house discovery efforts with our assay optimization services. You will receive your receptor in a BacMam delivery vector to ensure consistent, controllable receptor expression, an optimized protocol, and biosensor assay starter kit. Choose from GPCR assays for β-arrestin, cAMP, DAG, PIP2, and Calcium, or ask us about our biosensors for cGMP, Cell Stress, and SARS-CoV-2 protease inhibitors.
Get A Quote
We're here to help.
We don’t just run assays,
we have developed a full suite of the best in class, fluorescent biosensor assay kits for
do-it-yourselfers.


